UK Manufacturing Competitiveness Crisis
British manufacturers pay dramatically higher electricity costs than international competitors, threatening UK industrial viability.
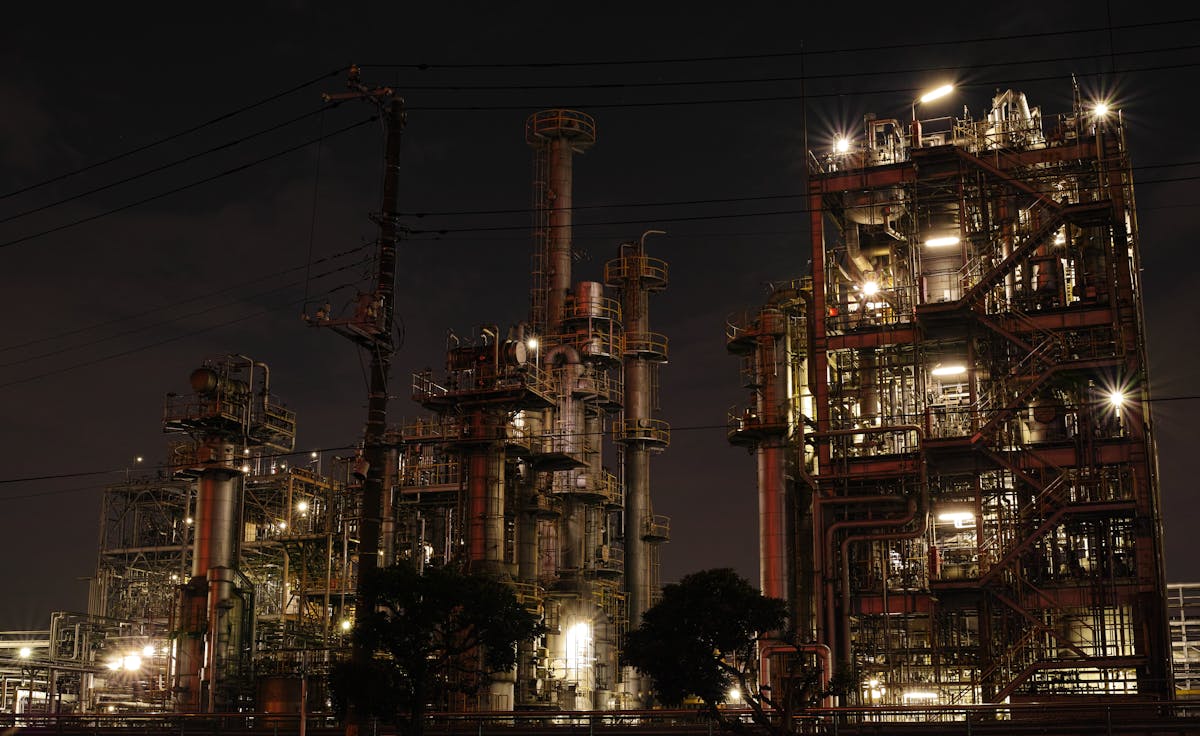
UK Manufacturing Electricity Costs 2026: Why British Factories Pay 40% More Than EU
UK manufacturers face a severe competitiveness crisis driven by electricity costs that are approximately 40% higher than key European competitors Germany and France, and roughly four times higher than the United States. This cost differential threatens the viability of British industry and requires immediate action.
The UK Industrial Electricity Cost Crisis
In 2026, UK industrial electricity prices average around 28-32p per kWh, while German and French manufacturers pay around 21-22p/kWh. American manufacturers benefit from rates as low as 7-8p/kWh in some states. This disparity creates an insurmountable competitive disadvantage for energy-intensive UK manufacturing.
International Electricity Cost Comparison (2026)
Source: International Energy Agency, UK Government DESNZ, industry surveys 2026
UK Industrial Electricity Prices by Year (2021-2026)
The scale of the cost shock becomes clear when you track industrial electricity prices across the past five years. The 2021-2023 energy crisis more than doubled effective rates for many UK manufacturers, and while wholesale prices have eased from their 2022 peak, the average price paid by industry in 2026 remains structurally far above pre-crisis levels. The figures below show the typical all-in price (wholesale plus network, policy and supplier costs) a mid-sized UK factory pays per kWh on a non-domestic contract.
| Year | Typical UK industrial price (p/kWh) | Change vs prior year | Market context |
|---|---|---|---|
| 2021 | ~15-17p | Baseline | Pre-crisis; gas prices still moderate |
| 2022 | ~30-40p | +100% or more | Gas price spike; energy crisis peak |
| 2023 | ~28-35p | Slight easing | Wholesale falling from peak; contracts still high |
| 2024 | ~26-32p | Down ~10% | Stabilising but well above 2021 |
| 2025 | ~27-31p | Broadly flat | Network and policy costs rising as wholesale falls |
| 2026 | ~28-32p | Broadly flat | Roughly double pre-crisis; relief not due until 2027 scheme |
Figures are indicative all-in rates for mid-sized non-domestic contracts (wholesale + network + policy + supplier margin). Actual prices vary by consumption volume, contract date and supplier. Source: Ofgem, DESNZ industrial price series, supplier non-domestic contract data.
Regional & By-Nation Cost Variation Across the UK
Where your factory sits in the UK changes its electricity bill. Distribution network use-of-system (DUoS) charges are set per region by each Distribution Network Operator (DNO), and they differ materially. Factories in the South West, South Wales and the East of England typically carry higher distribution charges than those in the Midlands or the North. The table below shows the typical relative position for a mid-sized industrial site, alongside the DNO that operates each region's network.
| Region / Nation | Distribution Network Operator (DNO) | Typical all-in industrial price (p/kWh) | Relative position |
|---|---|---|---|
| Midlands (East & West) | NGED | ~28-31p | Around average |
| South West England | NGED | ~30-33p | Higher (high DUoS) |
| South Wales | NGED | ~30-33p | Higher (high DUoS) |
| North West England | Electricity North West | ~27-30p | Lower-to-average |
| North East & Yorkshire | Northern Powergrid | ~27-30p | Lower-to-average |
| London & South East | UK Power Networks | ~28-32p | Around average |
| East of England | UK Power Networks | ~29-32p | Higher |
| Scotland | SP Energy Networks / SSEN | ~27-31p | Varies north vs central |
Regional differences reflect DUoS distribution charges set per network area. The Midlands, South West and South Wales are all served by National Grid Electricity Distribution (NGED). Source: DNO published DUoS charging statements, Ofgem regional price data.
UK vs Germany, France & USA: The Competitiveness Gap in Numbers
The headline figure — UK manufacturers paying around 40% more than their German and French rivals and roughly four times US rates — translates directly into pounds on the bottom line. The table below models the annual electricity bill for the same 2,000 MWh (2,000,000 kWh) factory in each country, showing exactly how much the location of production changes the cost base.
| Country | Industrial price (p/kWh) | Annual cost @ 2,000 MWh | vs UK |
|---|---|---|---|
| United Kingdom | ~30p | £600,000 | — |
| Germany | ~22p | £440,000 | £160,000 cheaper |
| France | ~21p | £420,000 | £180,000 cheaper |
| USA (average) | ~7-8p | £150,000 | £450,000 cheaper |
Worked at 2,000,000 kWh annual consumption. Overseas figures converted to pence/kWh equivalent for comparison. Source: IEA industrial electricity price data, Eurostat, US EIA.
Solar LCOE vs Grid Price: Why On-Site Generation Wins
The single most powerful lever a UK factory has is generating its own power. The Levelised Cost of Energy (LCOE) for a commercial rooftop solar array — the all-in cost per kWh once the system is paid off over its 25+ year life — sits far below what the grid charges, even after the 2027 industrial scheme delivers its planned ~25% reduction. At a typical install price of £700-1,000 per kWp and 3-5 year payback, every kWh a factory self-consumes is bought at roughly 5-7p instead of 28-32p.
| Source | Effective cost (p/kWh) | Price certainty | Saving vs UK grid |
|---|---|---|---|
| UK grid (2026) | ~28-32p | Volatile, contract-linked | — |
| UK grid after 2027 scheme (est. -25%) | ~21-24p | Still grid-dependent | ~7-8p |
| Commercial rooftop solar (LCOE) | ~5-7p | Fixed for 25+ years | ~22-26p per kWh |
| Solar + battery (self-consumption optimised) | ~7-9p | Fixed, plus peak-shaving | ~20-24p per kWh |
Solar LCOE based on £700-1,000/kWp install cost, ~25-year asset life and typical UK commercial yield. The 2027 scheme reduction is the government's stated ~25% target and is indicative only. See our factory solar panel costs guide for a full cost breakdown.
What's Driving UK's Premium Electricity Costs?
1. Network and Transmission Costs
UK electricity bills include substantial network charges to maintain and upgrade the transmission and distribution infrastructure. These costs are higher in the UK due to:
- Aging infrastructure requiring significant investment
- Geographic challenges with dispersed generation
- Higher financing costs for network operators
- Complex regulatory structures
2. Policy and Environmental Costs
UK manufacturers bear substantial policy costs embedded in electricity prices:
- Renewable Obligation Certificates (ROCs): Supporting renewable energy deployment
- Contracts for Difference (CfD): Guaranteeing returns for low-carbon generation
- Capacity Market: Ensuring generation adequacy
- Feed-in Tariffs (FiTs): Legacy small-scale renewable support
While these policies drive decarbonization, they disproportionately impact industrial electricity costs compared to competitor nations who structure policy costs differently.
3. Wholesale Market Factors
UK wholesale electricity prices are influenced by:
- Heavy dependence on gas-fired generation (gas price volatility)
- Limited interconnection with European markets
- Geographic isolation increasing price risk
- Historic underinvestment in low-cost generation
Real-World Impact
A medium-sized UK metal fabricator using 2,000 MWh annually pays £600,000 for electricity. The same consumption in Germany costs £440,000 (£160K savings), and in the USA just £150,000 (£450K savings). This cost differential eliminates profit margins and makes UK operations uncompetitive.
Government Response: 2027 Industrial Competitiveness Scheme
The UK Government has announced the British Industrial Competitiveness Scheme, set to launch in 2027. This program aims to:
Scheme Details:
- Reduce industrial electricity costs by approximately 25% through exemptions from certain policy costs
- Target energy-intensive industries most affected by cost differential
- Align UK industrial electricity costs closer to European averages
Why Waiting Until 2027 Is Problematic
While government action is welcome, waiting until 2027 presents significant challenges:
Challenges of Waiting
- • Three years of continued premium costs
- • Only 25% reduction (still above EU average)
- • Cumulative losses: £300K-£600K per facility
- • Risk of business closures before relief arrives
- • Lost investment opportunities
Solar Alternative
- • Immediate 40-70% cost reduction available NOW
- • System pays for itself before 2027
- • Benefits stack with government scheme
- • 25+ years of continued savings
- • Energy independence and stability
The Solar Solution: Immediate Cost Relief
On-site solar generation offers UK manufacturers immediate relief from premium electricity costs:
Solar Economics for UK Manufacturing
Case Study: Automotive Supplier, West Midlands
"Solar was essential for remaining competitive on international tenders. The cost differential with European competitors was unsustainable. Solar brought our energy costs in line with German rivals."
— Operations Director, Tier 1 Automotive Supplier
Annual Investment Allowance (AIA): Tax Benefits Boost Returns
Solar panels qualify for 100% Annual Investment Allowance (AIA), allowing profitable UK manufacturers to deduct the entire system cost against taxable profits in year one:
ECA Example: £300,000 Solar System
Industry-Specific Impact
Premium UK electricity costs disproportionately affect energy-intensive sectors:
Metal Processing & Fabrication
High electricity use from welding, plasma cutting, CNC machining, and heat treatment. Premium costs directly impact per-unit production costs and tender competitiveness.
Food Manufacturing & Cold Storage
24/7 refrigeration, freezers, and process cooling create massive electricity demand. Solar perfectly matches daytime operations for exceptional ROI.
Chemical & Pharmaceutical
Process heating, cooling, reaction vessels, and cleanroom HVAC demand constant power. High costs threaten UK production viability.
What Should UK Manufacturers Do?
Action Plan: Don't Wait for 2027
- 1. Assess Solar Feasibility Now: Evaluate your facility's suitability for solar. Most industrial buildings are excellent candidates with 10,000+ sqm of available roof space.
- 2. Calculate True ROI: Factor in Annual Investment Allowance (AIA), energy price inflation, and the cost of waiting until 2027 (£300K-£600K in lost savings).
- 3. Consider Solar PPA if Capital Constrained: Power Purchase Agreements offer zero upfront costs with immediate 25-40% savings.
- 4. Act Before Demand Surges: As more manufacturers recognize solar's necessity, installation capacity will tighten. Early movers secure better terms and faster installation.
- 5. Integrate with Business Strategy: Solar isn't just cost reduction—it's a competitive advantage, green credential, and hedge against future energy volatility.
How to Reduce Manufacturing Energy Costs in 2026
With grid rates stuck around 28-32p/kWh and meaningful government relief not arriving until the 2027 scheme, UK manufacturers cannot afford to wait passively. The most effective cost-reduction measures, in rough order of impact, are:
- Install on-site solar PV. Self-generation at a 5-7p/kWh LCOE is the single largest sustained reduction available, with 3-5 year payback. See our full guide to manufacturing energy cost reduction with solar.
- Add battery storage for peak shaving. Shifting consumption away from expensive peak periods and storing surplus daytime solar maximises self-consumption and trims DUoS and capacity charges.
- Right-size the system to your load. Matching array capacity to your half-hourly demand profile avoids costly export and accelerates payback — budget around £700-1,000 per kWp installed. Our factory solar panel costs guide breaks down system pricing by size.
- Claim the Annual Investment Allowance. Solar qualifies for 100% AIA up to £1m, letting profitable manufacturers deduct the full system cost against year-one profits and cut effective payback to under 3 years.
- Improve energy efficiency first. LED lighting, variable-speed drives, compressed-air leak fixes and heat recovery cut the base load that solar then has to cover.
- Negotiate supply contracts and check your DNO region. Distribution charges vary by region (see the table above), so benchmark your all-in rate before renewing.
For most energy-intensive UK factories, the combination of on-site solar, battery storage and the AIA tax shield delivers immediate double-digit savings that stack on top of any future government relief — turning a structural cost disadvantage into a long-term competitive edge.
Conclusion: Solar as Competitive Necessity
UK manufacturers face an unprecedented electricity cost crisis that threatens industrial competitiveness. While government intervention in 2027 will help, it arrives too late and provides insufficient relief for many businesses.
Solar generation offers immediate, substantial cost reduction—40-70% savings available today, not in three years. For energy-intensive UK manufacturers, solar has transitioned from "nice to have" to competitive necessity.
The choice is clear: wait three years for partial government relief while bleeding £300K-£600K, or invest in solar today and achieve energy independence, predictable costs, and competitive parity with European rivals.
Don't Wait Until 2027
Get a detailed feasibility assessment showing your potential savings vs the cost of waiting
Request Free Assessment